Question 1#
The ECG changes in the figure below:
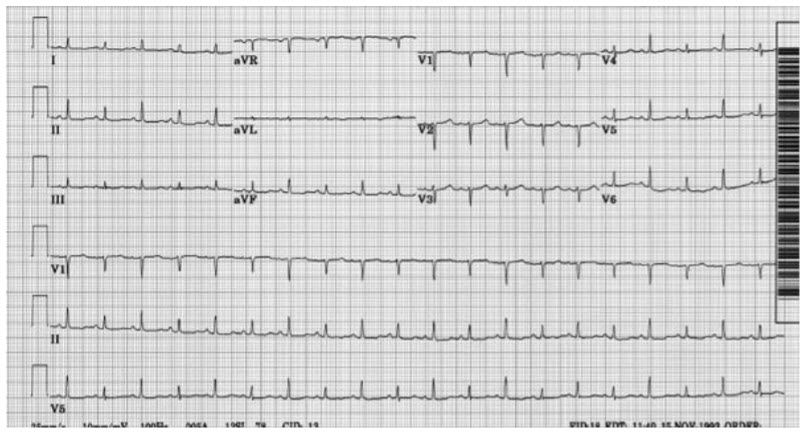
are diagnostic of:
A. Pericardial effusionB. Chronic lung disease
C. Mitral valve disease
D. Acute pericarditis
E. Coronary artery disease
Correct Answer is A
Comment:
On this electrocardiogram, there is a sinus tachycardia. The voltage is low and in the V1 and II rhythm strips, electrical alternans can be seen. This is an ECG from a patient with cardiac tamponade (pericardial effusion).